
How do we involve our students?

Listening to our students is something which has been important to us over many years. We have both formal and informal ways of interacting with our students.
- Our Student Union has 23 members of its executive committee, nominated by students
- The Student Executive are members of Student Committee, a formal sub-committee of the Governing Body, which is established to meet 3 times a year
- All students are involved in electing a Student Union President
- We have student representatives for every course, nominated by the class
- Three student conferences are held each year
- 226 student representatives attended the conferences last year
- The Student Union organised 10 trips during the year although they were curtailed due to Covid-19.
- Students attended Safe Drive Stay Alive and Prevent
- Senior Managers together with a student executive drop into classes termly to check student satisfaction
We survey our students three times a year, in the first few weeks, in the Spring Term (a survey run by the Education & Skills Funding Agency although this was cancelled in 2020 due to Covid-19) and at the end of the year. This gives us excellent feedback on what is good and where improvements need to be made.
How well do our students succeed?

We measure the achievement of our students through ‘achievement rates’. These are calculated by multiplying the number of students who remain on a course for its duration by the number who achieve, expressed as a percentage. From 2013-14, functional skills rates have been included as part of the success rate which has reduced the results nationally.
| Our achievement rates for 2019/20 | |||
| 2019/20 | National Average (NA) | Variance to NA* | |
| All | 88.0% | 86.7% | 1.3% |
| 16-18 | 88.7% | 86.7% | 2.0% |
| 19+ | 85.5% | 86.7% | 1.2% |
Crawley College saw a significant improvement from the previous year’s results and is on a journey of improvement.
What do our students say about us?
We pride ourselves on delivering outstanding teaching and learning to our students and ensuring that they are happy and fulfilled in their studies whilst achieving the very best possible grades in preparation for employment or university. In our end of year student survey 2,146 students took part.
- 92% of students said that their teaching and learning was good
- 89% said that their lessons were varied and interesting
- 95% said that their teachers were helpful and approachable
- 89% of students said that their lessons were well planned
- 89% of students felt that their written work was returned with comments which helped to improve the standard of their assignments
- 88% of students felt that the atmosphere at college feels safe and welcoming
- 91% of students are proud to be a student at Crawley College
Where do our students go next?
The College used an external company to gather data on the destination of all full time learner responsive students who left Crawley College in the summer of 2019. The results are as follows:
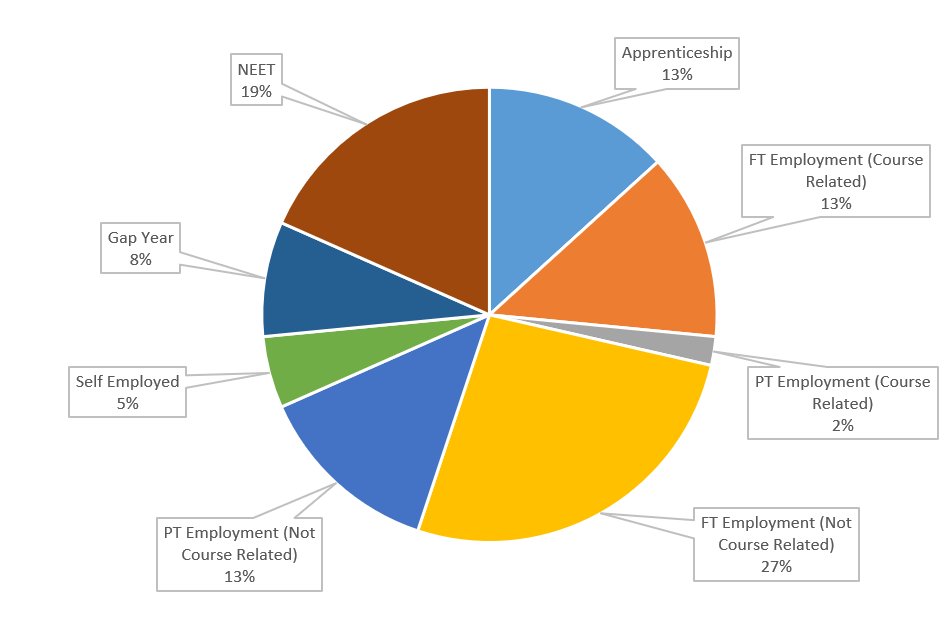
Key Headlines for all full time learner responsive students who did not continue to study in FE
- 81.63% have a positive destination (in employment, an apprenticeship, or completing voluntary work/a gap year)
- 13.27% went into an apprenticeship
- The number of those not in education, training or employment totals 18.37% in comparison to 6.58% in 2018. This reflects the challenges young people are facing to find jobs.